Describes only the product direction and current evidence; it does not promise live data, accounts, or subscriptions.

NewsLightglobal news situation
NewsLight
NewsLight is exploring how to organize news, media rights, sources, geolocation and tagged AI summaries into traceable global posture interfaces.
public status
Interaction sample is accessible
No authorized live news source or subscription is public; samples do not represent news facts or event freshness.
Entry boundaries
The website, experience sample, and Web App are three distinct states.
The official website is responsible for explaining the product; the demo only displays clearly marked fixed samples; the Web App source code candidate allows local storage and offline readback without an account, but it has not yet been deployed to the public network, and the demo session will not be used to disguise the account service.
Uses fixed samples and Baiheng-owned demonstration media; when API evidence is insufficient it always falls back to Demo.
Installable shells, Demo judgment and local databases have become candidates; public network deployment, login, synchronization and collaboration are still not open.
View NewsLight status notes;The page being reachable does not mean that the data has been authorized.
Positioning
Not a news list, but a global event radar.
NewsLight is for people who need to understand global change quickly. It keeps news, location, media, sources, and potential impact in one space, reducing constant source switching.
event signal model
The experience sample shows how scattered events can be organized into signal streams in the future; the current content is not real-time authorized news.
Media rights first
Media is only displayed if its rights status is clear; unknown, Review, or unauthorized media is hidden by default.
Geographic mapping
Map events to cities, countries, and market nodes so spatial relationships are visible on the globe.
tagged abstract
Human, AI, and source summaries remain distinguishable and users are reminded to verify against the original source.
Interactive preview
The globe is the interface, not a backdrop.
Drag the globe to enter events from a global view. Signals stay anchored to the surface and update the event summary when selected.
Drag to rotate
Event signals
Linked summaries
Interactive Earth Preview
Load 3D after moving pointer, touch or keyboard focus
Drag to rotate · Select a signal
Experience sample · Non-real time · Sample time
Technology Infrastructure Event Card Sample
This is only a demonstration of how the abstract, location and media rights entries are linked and does not represent real events.
Who it is for
For people who need to understand world change quickly.
NewsLight is not a casual news feed. It is an observation interface for people who need to judge context, track risk, and understand regional change.
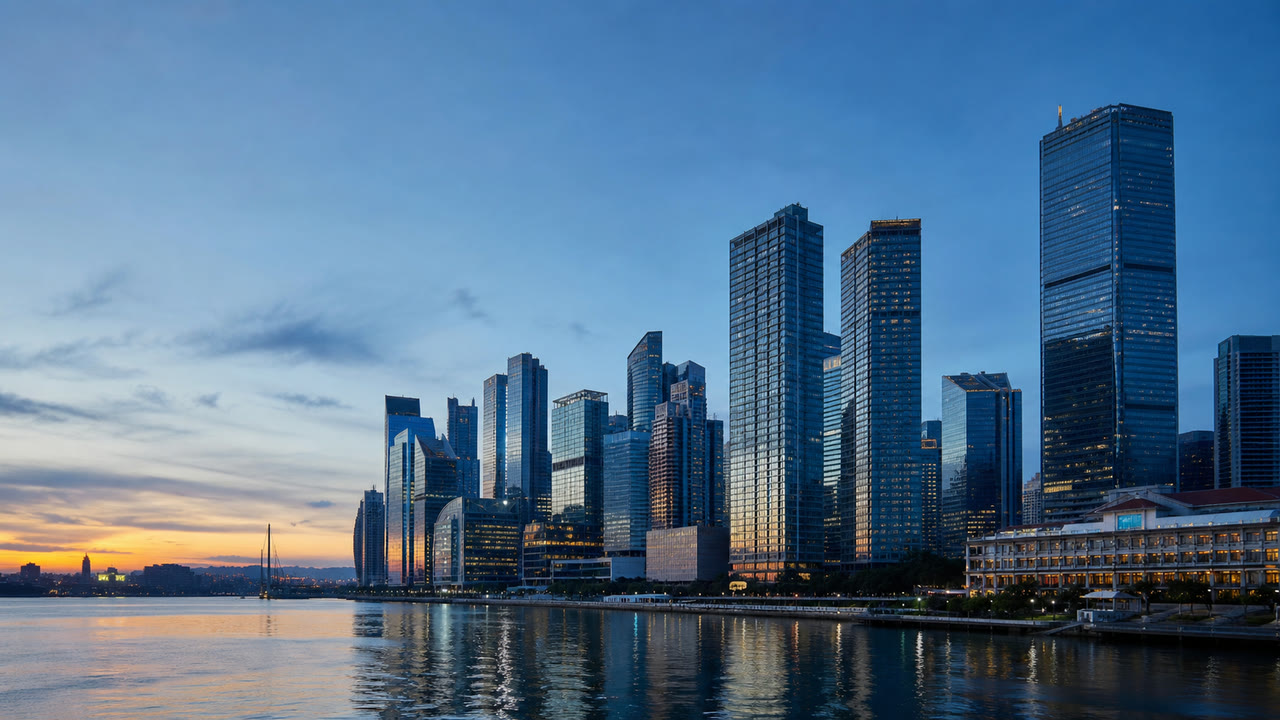
market observation
Market and investment intelligence
Scan macro, industry, energy, and regional events, turning scattered news into decision-ready global signals.
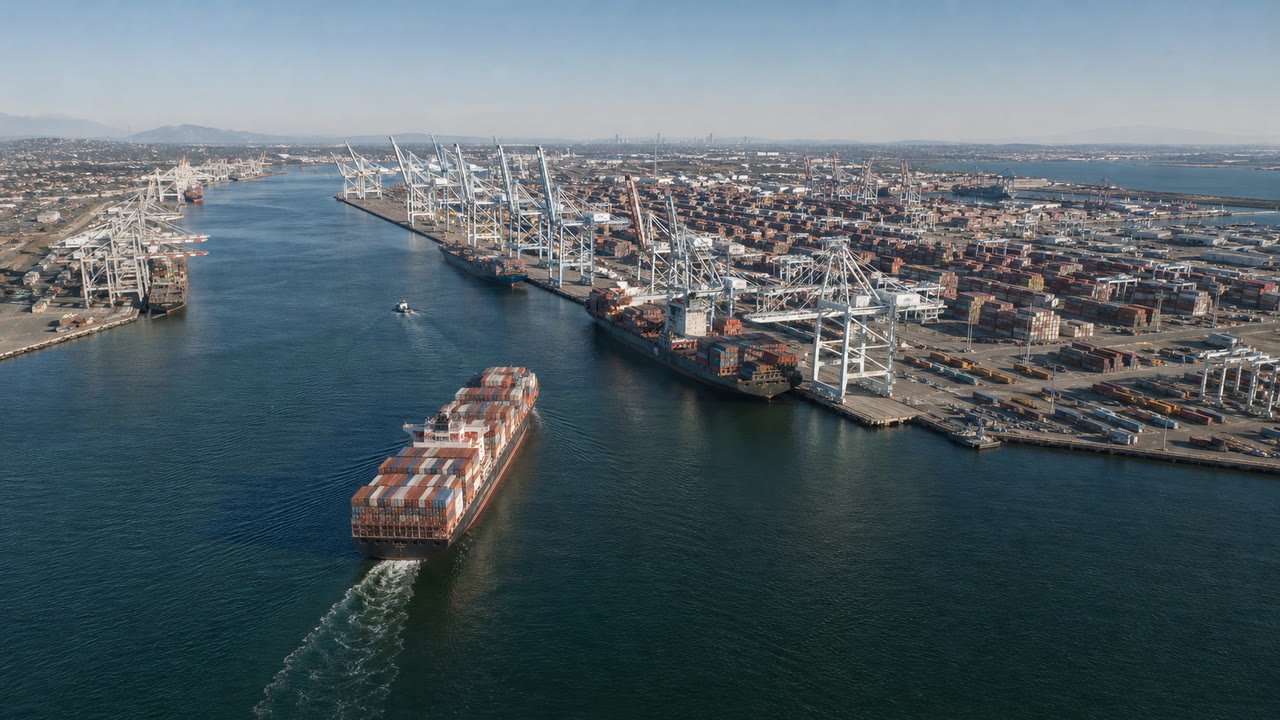
Business operations
Business and supply chain
Return events around regions, ports, energy, and industry chains to the map so teams can understand external change.
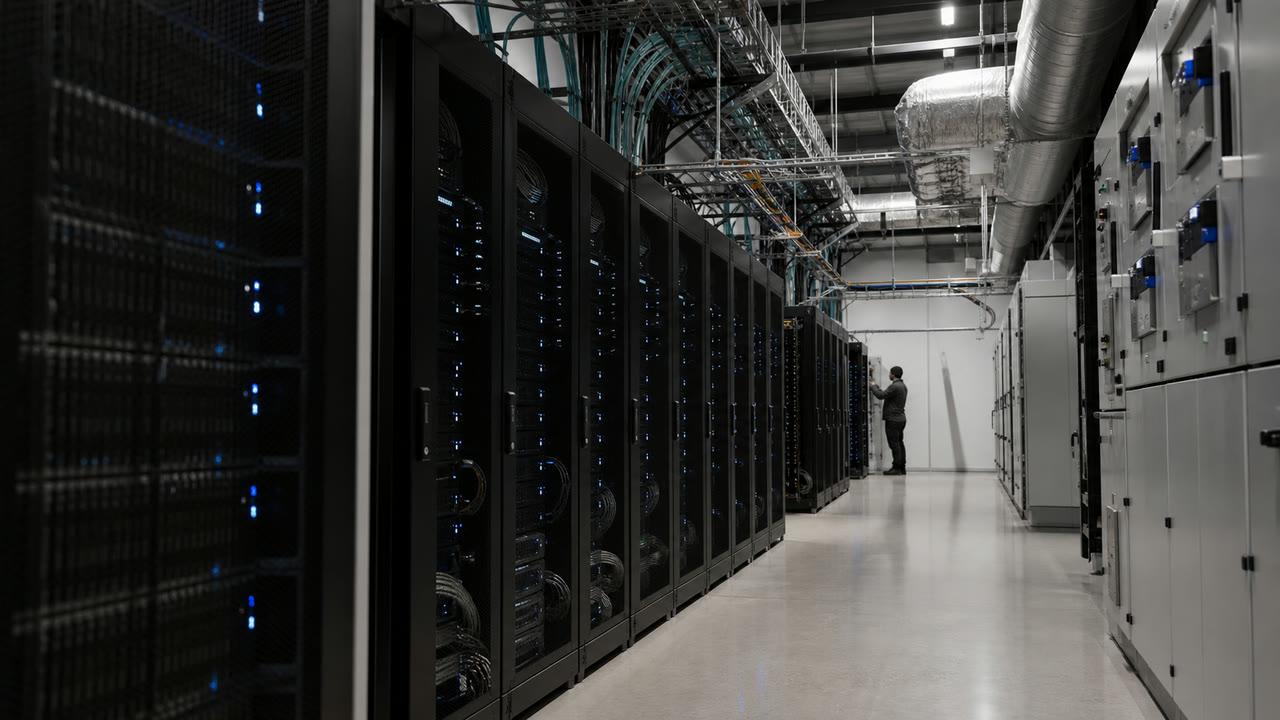
research analysis
Research, media, and content
Organize news spatially to establish context, regional relationships, and follow-up leads quickly.
Core experience
From globe to event card to media, understand what is happening in one flow.
Start with the global situation, then enter individual events. Location, summary, impact, and media turn reading from searching for news into seeing the world.
Drag the globe
Rotate and zoom the globe to understand how news is distributed in space.
Event signals
Important events appear as globe signals; hover or select one to open its card.
Media cards
Images, video, and summaries stay together in one event card, reducing page switching.
Intelligence cues
Condense long news into short explanations and impact directions for faster initial judgment.
Use cases
Three frequent workflows.
For morning scans, major event tracking, or regional comparison, NewsLight puts news back where it happened.
Morning world scan
Open the globe, identify regions with dense recent signals, then enter the events that matter.
Major event tracking
Follow event cards around one region, industry, or theme to build context quickly.
Cross-region comparison
Place events from different countries and cities in one space to compare risk, opportunity, and connections.
Experience design
Complexity is organized behind the scenes; users see a clear world.
NewsLight puts event organization, location judgment, media presentation, and interaction into one product flow. Users do not need to understand complex data processing; they open the globe and see the spatial relationships behind world news.
Event model example
Media cards
Geographic context
Multi-device experience
01Event discovery
02Information organization
03Location understanding
04Media presentation
05Web/App
Media experience
Media, location, and sources form the event context together.
Every media item is tied to the event summary, coordinates, source status, and reading progress; it never serves as detached mood imagery.
Event card
Summary, region, and impact in one view
Selecting a signal brings the title, summary, impact, region, and category into one view, reducing context switching.
- Event
- market signals
- Location
- Global / Finance
- State
- Human experience summary · Not real-time
Technology context
Infrastructure linked to industry context
Media appears only when it adds event context and is presented with the summary, location, and source status.
- Event
- infrastructure signals
- Media
- Event context image
- State
- Experience sample
Location context
Regional events linked to location
Media stays connected to the map and is interpreted with place, regional relationships, and the event card.
- Event
- supply chain path
- Location
- Regional linkage
- State
- Experience examples · Non-news facts
Online Preview
The interaction sample is accessible.
Explore globe dragging, event selection, and Baiheng-owned demonstration media. No authorized live-news source is public, and accounts, subscriptions, and formal clients are not yet open.
NL NewsLight Feedback
Confirm the delivery result after submission.
Choose the closest category and describe the problem. The form will not be claimed to have been delivered before it is submitted; the delivery result will only be displayed after the server confirms success.